Epigenetic Markers Predict Type 2 Diabetes Patients Response to Metformin
|
By LabMedica International staff writers Posted on 29 Sep 2020 |
|
.")
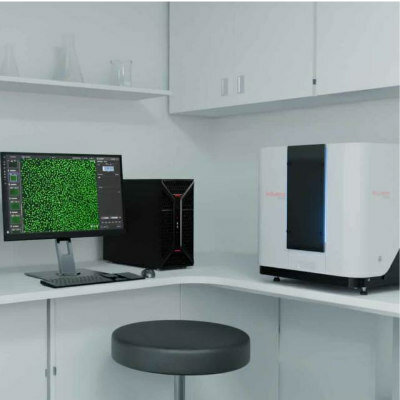
Image: Various types of data analysis using BeadStudio Methylation Module with Illumina`s MethylationEpic array (Photo courtesy of Phoebe Lu).
Generally, metformin is the first medication prescribed for type 2 diabetes (T2D). It works by lowering glucose production in the liver and improving the body's sensitivity to insulin so that the body uses insulin more effectively. Currently, there are no phenotypes that successfully predict glycemic response to, or tolerance of, metformin.
About 30% of patients do not respond to metformin and between 20% and 30% experience side effects that can be intolerable Gastrointestinal side effects of metformin are observed in 10% to 15% of patients, depending on the dose, and include abdominal discomfort, anorexia, bloating, and diarrhea. Because insulin secretion is unaltered, hypoglycemia is not a side effect of metformin used as monotherapy.
An international team of clinical scientists led by those at Skåne University Hospital (Malmo, Sweden) conducted multiple epigenome-wide association studies by analyzing in the blood of drug-naïve patients who were recently diagnosed with T2D. Blood samples were collected from the All New Diabetics In Scandia (ANDIS) cohort and analyzed using Illumina's MethylationEpic array (Illumina, San Diego, CA, USA). The team sought to gauge whether differences in DNA methylation prior to treatment could predict whether individuals had changes in glycated hemoglobin (HbA1c), responded to the drug treatment, or experienced intolerance to the drug following about a year and a half of metformin treatment.
The investigators identified more than 2,500 methylation sites that were significantly associated with changes in HbA1c, a marker of blood glucose levels. In the replication cohort, 132 CpGs of these sites were validated. They additionally uncovered 7,916 methylation sites that differed between individuals with T2D who responded to metformin and individuals who did not. Of those, 601 were then validated in the ANDIS replication cohort and 329 in an additional cohorts.
In all, 33 CpG sites were associated with future metformin response in all cohorts, and in a combined meta-analysis 11 sites reached genome-wide significance. At the same time, the team found 9,676 methylation sites that differed between individuals with T2D who could tolerate metformin treatment and those who could not. In the ANDIS replication cohort, 235 CpGs were validated, and in the replication cohort, 352 CpGs were. Seven CpGs were associated with metformin in all cohorts, and in a combined meta-analysis four sites reached genome-wide significance.
The scientists generated two methylation risk scores, one of metformin response and one of metformin intolerance. For the metformin response, they bundled together the 11 sites to form a weighted methylation risk score that could differentiate between responders and non-responders with an area under the curve of between 0.80 and 0.89. Meanwhile, for metformin intolerance, they combined the four sites that reached genome-wide significance into a separate risk score that could differentiate between tolerant and intolerant individuals with an area under the curve of between 0.85 and 0.94.
The authors concludes that they could discriminate between glycemic responders/non-responders and participants tolerant/intolerant to metformin at diagnosis by measuring blood-based epigenetic markers in drug-naïve patients with T2D. This epigenetics-based tool may be further developed to help patients with T2D receive optimal therapy. The study was published on September 16, 2020 in the journal Science Translational Medicine.
New
Gold Member
Pre- Eclampsia Control
Acusera Pre-Eclampsia Control
Immunofluorescence Analyzer
IFA System
Food Allergy Screening ELISA Kit
Allerquant 14G B ELISA
Latest Molecular Diagnostics News
- Ultrasensitive ctDNA Assay Detects MRD in Breast, Colorectal, Renal Cancers
- Genetic Marker Supports Anti-TNF Therapy Selection in Crohn’s Disease
- Female-Specific RNA Biomarker May Help Explain Sex Differences in Immune Disease
- Genomic Test Guides Taxane-Based Chemotherapy Selection in Breast Cancer
- RNA Blood Test May Enable Earlier Alzheimer’s Disease Diagnosis
- AI Reasoning Model Generates Diagnostic Leads for Unresolved Rare Disease Cases
- Point-of-Care Molecular Test Detects Group A Strep in Minutes
- Spatial Map Guides Treatment Selection in Muscle-Invasive Bladder Cancer
- Point-of-Care PCR Panel Detects RSV, Influenza, and SARS-CoV-2 in Minutes
- Whole-Genome Sequencing Enables Genetic Diagnosis in Neurodevelopmental Disorders
- Genetic Testing Identifies High-Risk Patients with Inflammatory Bowel Disease
- Genomic Study Identifies Risk Regions for Intrahepatic Cholestasis of Pregnancy
- Genetic Testing and Surveillance Cuts Costs and Improves Survival in Li-Fraumeni Syndrome
- New Blood Test Predicts Organ-Specific Disease and Mortality Years in Advance
- Ancestry-Informed Genomics Advances Precision Cancer Prognosis
- Long-Read DNA Test Improves Diagnosis of Rare Genetic Diseases
Channels
Clinical Chemistry
view channel")
Blood Protein Signature Diagnoses Pediatric IBD and Distinguishes Subtypes
Confirming pediatric inflammatory bowel disease (IBD) often requires imaging, endoscopy, and histopathology, prolonging time to diagnosis. Reliable, noninvasive blood tests remain an unmet need in routine... Read more")
Blood Test Detects More High-Risk Prostate Cancers Than PSA
Prostate cancer is one of the most common malignancies in men, and screening often struggles to distinguish indolent tumors from clinically significant disease. Prostate-specific antigen (PSA) testing... Read more")
")
Hematology
view channel")
Next-Generation Hematology Platform Streamlines High-Complexity Lab Workflows
Sysmex America (Chicago, IL, USA) has introduced the next generation XR-Series, centered on the XR-10 Automated Hematology Module for high-complexity laboratories. The platform builds on the widely used... Read more. DOI: 10.1186/s13046-026-03688-5)")
Blood Eosinophil Count May Predict Cancer Immunotherapy Response and Toxicity
Immune checkpoint inhibitors have improved outcomes across many cancers, yet only a subset of patients derive durable benefit and biomarkers to guide treatment remain limited. Eosinophils, best known for... Read more")
")
Immunology
view channel")
Lung Immune Profiling Reveals Distinct Severe Pneumonia Subtypes
Severe pneumonia often progresses to respiratory failure requiring intensive care and mechanical ventilation. Despite similar clinical presentations, outcomes vary widely, complicating decisions on an... Read more")
Lab-on-a-Chip Approach Advances Immune–Cancer Cell Interaction Analysis
Conventional cytotoxicity assays often average responses across thousands of cells, obscuring how individual immune cells engage and kill tumor cells. For immunotherapy evaluation, the precise sequence... Read more and nucleocapsid (N) proteins, as a tool to characterize long COVID (Image credit: iStock)")
Microbiology
view channel")
Study Reveals Widespread Community Spread of Drug-Resistant Klebsiella
Multidrug-resistant Klebsiella pneumoniae is an escalating community health concern, driving recurrent urinary tract infections in older adults and complicating first-line antibiotic therapy.... Read more")
Stronger Laboratory Services Support Timely Melioidosis Diagnosis Amid Global Spread
Melioidosis, a potentially fatal infection caused by Burkholderia pseudomallei, remains difficult to recognize because its symptoms can mimic tuberculosis and other illnesses. The disease is considered... Read more. https://doi.org/10.1002/jev2.70286)")
Extracellular Vesicle Biomarker May Enable Noninvasive Monitoring of H. pylori
Helicobacter pylori infects an estimated 43.9% of the global population, affecting approximately 4.4 billion people worldwide. In many regions, including Africa, Eastern Europe, and Southeast Asia, prevalence... Read more")
Rapid Molecular Screening Aims to Accelerate Hospital Infection Control for CPE
Drug-resistant infections remain a critical patient-safety threat in hospitals, with carbapenemase-producing Enterobacterales (CPE) among the most urgent concerns. In England, reports of acquired carbapenemase... Read morePathology
view channel")
Uncertainty-Aware AI Tool Improves Digital Pathology for Cancer Subtyping
Reliable histologic subtyping guides therapy selection in oncology, yet diagnostic workflows grow more complex as whole-slide imaging and artificial intelligence (AI) expand. A persistent obstacle to clinical... Read more")
Study Highlights Biomarker Testing Delays in Lung Cancer Care
Timely biomarker results are critical to match lung cancer patients with targeted therapies or immunotherapies, yet many clinical pathways still delay testing after biopsy. Ordering responsibility, reimbursement... Read more")
 RxDx Assay is a qualitative IHC assay for assessing PTEN protein in prostate adenocarcinoma, with staining performed using the OptiView DAB IHC Detection Kit on a BenchMark ULTRA instrument (Photo courtesy of Roche)")
Technology
view channel")
AI Platform Links Biomarker Results to Cancer Clinical Trials and Guidelines
Oncology teams must manage growing volumes of genomic data, rapidly evolving clinical trial options, and frequently updated care guidelines, all within tight clinic schedules. Translating complex tumor... Read more")
Agentic AI Platform Supports Genomic Decision-Making in Oncology
Oncology care teams increasingly face the challenge of managing complex molecular diagnostics, evolving treatment options, and extensive electronic health record documentation. Translating multimodal data... Read more")
")
Industry
view channel")
Agreement Supports pTau217-Based Alzheimer’s Blood Test Development
As disease-modifying therapies for Alzheimer’s disease expand, accessible diagnostics are increasingly needed to identify patients earlier. Current confirmatory methods, including PET imaging and cerebrospinal... Read more")
")