Epigenetic Markers Predict Type 2 Diabetes Patients Response to Metformin
By LabMedica International staff writers
Posted on 29 Sep 2020
Generally, metformin is the first medication prescribed for type 2 diabetes (T2D). It works by lowering glucose production in the liver and improving the body's sensitivity to insulin so that the body uses insulin more effectively. Currently, there are no phenotypes that successfully predict glycemic response to, or tolerance of, metformin.Posted on 29 Sep 2020
About 30% of patients do not respond to metformin and between 20% and 30% experience side effects that can be intolerable Gastrointestinal side effects of metformin are observed in 10% to 15% of patients, depending on the dose, and include abdominal discomfort, anorexia, bloating, and diarrhea. Because insulin secretion is unaltered, hypoglycemia is not a side effect of metformin used as monotherapy.
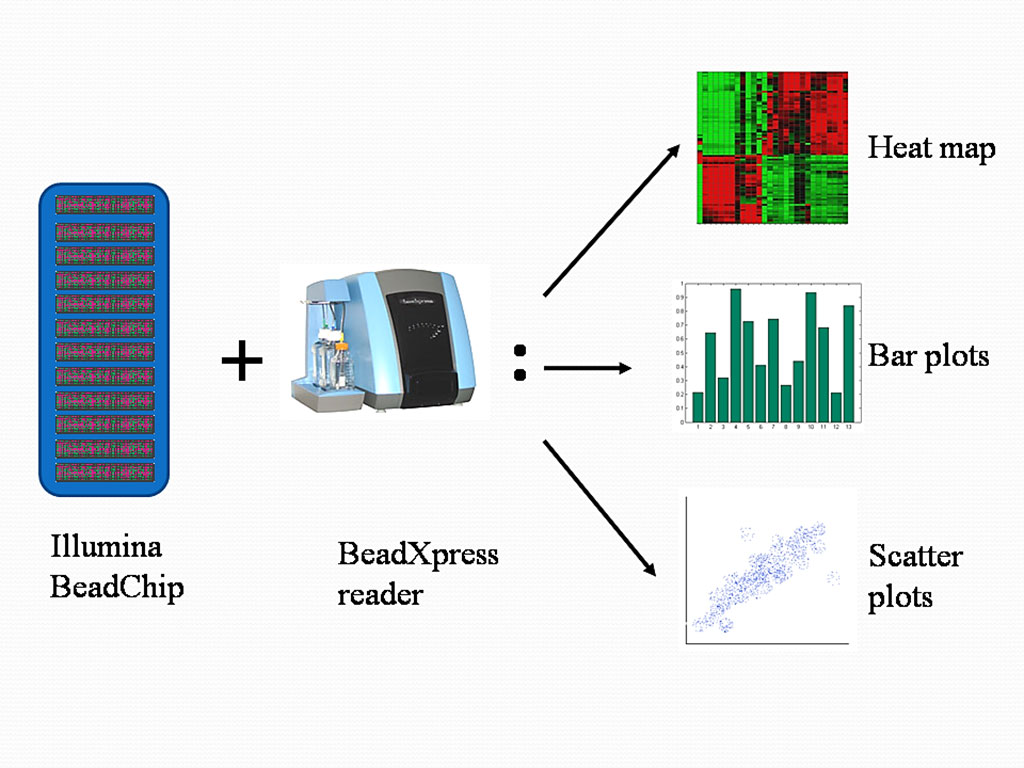
Image: Various types of data analysis using BeadStudio Methylation Module with Illumina`s MethylationEpic array (Photo courtesy of Phoebe Lu).
An international team of clinical scientists led by those at Skåne University Hospital (Malmo, Sweden) conducted multiple epigenome-wide association studies by analyzing in the blood of drug-naïve patients who were recently diagnosed with T2D. Blood samples were collected from the All New Diabetics In Scandia (ANDIS) cohort and analyzed using Illumina's MethylationEpic array (Illumina, San Diego, CA, USA). The team sought to gauge whether differences in DNA methylation prior to treatment could predict whether individuals had changes in glycated hemoglobin (HbA1c), responded to the drug treatment, or experienced intolerance to the drug following about a year and a half of metformin treatment.
The investigators identified more than 2,500 methylation sites that were significantly associated with changes in HbA1c, a marker of blood glucose levels. In the replication cohort, 132 CpGs of these sites were validated. They additionally uncovered 7,916 methylation sites that differed between individuals with T2D who responded to metformin and individuals who did not. Of those, 601 were then validated in the ANDIS replication cohort and 329 in an additional cohorts.
In all, 33 CpG sites were associated with future metformin response in all cohorts, and in a combined meta-analysis 11 sites reached genome-wide significance. At the same time, the team found 9,676 methylation sites that differed between individuals with T2D who could tolerate metformin treatment and those who could not. In the ANDIS replication cohort, 235 CpGs were validated, and in the replication cohort, 352 CpGs were. Seven CpGs were associated with metformin in all cohorts, and in a combined meta-analysis four sites reached genome-wide significance.
The scientists generated two methylation risk scores, one of metformin response and one of metformin intolerance. For the metformin response, they bundled together the 11 sites to form a weighted methylation risk score that could differentiate between responders and non-responders with an area under the curve of between 0.80 and 0.89. Meanwhile, for metformin intolerance, they combined the four sites that reached genome-wide significance into a separate risk score that could differentiate between tolerant and intolerant individuals with an area under the curve of between 0.85 and 0.94.
The authors concludes that they could discriminate between glycemic responders/non-responders and participants tolerant/intolerant to metformin at diagnosis by measuring blood-based epigenetic markers in drug-naïve patients with T2D. This epigenetics-based tool may be further developed to help patients with T2D receive optimal therapy. The study was published on September 16, 2020 in the journal Science Translational Medicine.


