Calculation of Melanoma Mitotic Rate Standardized on Whole Slide Images
By LabMedica International staff writers
Posted on 19 Oct 2021
Mitotic rate is an important factor with prognostic relevance in melanoma as well as in other neoplasms. Higher mitotic activity correlates significantly with reduced survival, and is an important parameter in prognostic models offering tailored predictions of prognosis for individual patients with melanoma.Posted on 19 Oct 2021
However, accurate mitotic figure counting on hematoxylin-eosin–stained sections can be labor-intensive and challenging. Ideally, the area of the lesion containing the most mitotic figures (the “hot spot”) is identified, and then the mitotic rate is calculated in a 1-mm2 region encompassing the hot spot. The recent availability of digital whole slide image (WSI) data sets from glass slides creates new opportunities for computer-aided diagnostic technologies.
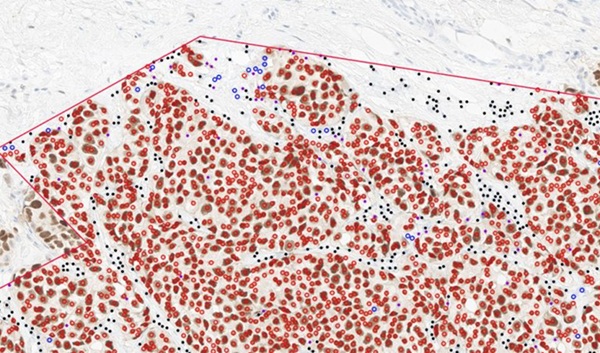
, the more likely the tumor is to have metastasized (Photo courtesy of Arlen Ramsey)")
Image: Mitotic Rate and Melanoma Diagnosis: The higher the mitotic count (circled), the more likely the tumor is to have metastasized (Photo courtesy of Arlen Ramsey)
Pathologists at the University of Texas MD Anderson Cancer Center (Houston, TX, USA) established a standardized method to enclose a 1-mm2 region of interest for mitotic figure (MF) counting in melanoma based on WSIs and assess the method's effectiveness. They retrospectively searched their institutional pathology database and chose 30 melanoma cases with reported mitotic figures ranging from 0 to 28. The WSIs for these 30 melanoma cases were created by digitally scanning the original H&E-stained glass slides at ×20 magnification with a ScanScope digital pathology system (Aperio, Vista, CA, USA) with SVS format.
Mitotic figures were defined as the unequivocal presence of extensions of chromatin (condensed chromosomes) extending from a condensed chromatin mass, corresponding to either a metaphase or telophase figure. For each WSI, the mitotic rate was evaluated by first finding the hot spot (i.e., the region of the lesion containing the most mitotic figures) and then counting mitotic figures beginning in the hot spot and then extending to the immediately adjacent non-overlapping viewing fields until an area of tissue corresponding to 1 mm2 was assessed. Fixed-shape annotations with 500 × 500-μm squares or circles were applied depending on the specimen orientation during mitotic figure counting, because this approach is able to achieve convenient annotation and efficient counting while ensuring easy transition from traditional glass slides.
The scientists reported that of the monitors they examined, a 32-inch monitor with 3840 × 2160 resolution was optimal for counting MFs within a 1-mm2 region of interest in melanoma. When WSIs were viewed in the ImageScope viewer, ×10 to ×20 magnification during screening could efficiently locate a hot spot and ×20 to ×40 magnification during counting could accurately identify MFs. Fixed-shape annotations with 500 × 500-μm squares or circles can precisely and efficiently enclose a 1-mm2 region of interest. Their method on WSIs was able to produce a higher mitotic rate than with glass slides.
The authors concluded that mitotic figure counting in melanoma using WSIs is equivalent to using glass slides and can be efficiently done in real practice. In terms of annotation methodology, they recommended fixed-shape annotations with 4 squares or 5 circles in a setting of 500 × 500 μm to cover a 1-mm2 region. The pathologist can easily enclose the region of interest of the tumor and effectively match up irregular tumor regions with position adjustments of the four squares or five circles. If the tumor has a large contiguous area, a single-square annotation of 1000 × 1000 μm can be used. Their methodology can be potentially extended to calculating mitotic rate in other tumors. The study was published in the October, 2021 issue of the journal Archives of Pathology and Laboratory Medicine.
Related Links:
University of Texas MD Anderson Cancer Center
Aperio

Gold Member
Aspiration System
VACUSAFE

CMV CLIA Diagnostic
CLIA CMV IgA Screen Group

Chromogenic Culture System
InTray™ COLOREX™ ECC