Image Analysis System Quantifies NASH Disease Activity
By LabMedica International staff writers
Posted on 25 Apr 2018
Non-alcoholic steatohepatitis (NASH) is the progressive form of non-alcoholic fatty liver disease (NAFLD), in which excessive fat accumulates in the liver of individuals who do not have a history of alcohol abuse.Posted on 25 Apr 2018
NAFLD is regarded as a hepatic manifestation of metabolic syndrome, with the number of individuals with NAFLD/NASH increasing rapidly worldwide, in parallel with the increasing prevalence of obesity. Although clinical algorithms based on blood test results are being developed to identify patients with progressive NASH, liver biopsy remains essential to establish both the diagnosis of NASH and the severity of the disease.
.")
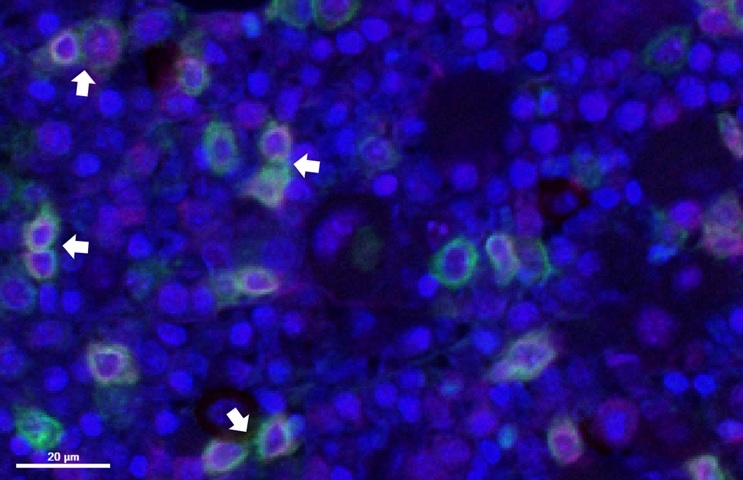
Image: A histopathology micrograph of a liver biopsy showing of steatohepatitis showing balloon degeneration of hepatocytes, a form of apoptosis (Photo courtesy of Nephron).
In a study, a murine model fed a choline-deficient, L-amino-acid-defined diet supplemented with cholesterol was used to evaluate hepatocellular ballooning and lobular inflammation in liver biopsy samples. An expert histopathologist determined the ballooning and inflammation scores for all the animals included in the study, and deep-learning models were constructed to detect and analyze these histological features. An initial training set of 31 was used to calibrate ballooning and inflammation for subsequent prediction of these histological features in four independent cohorts (n=271).
The study found that deep-learning algorithms applied using open-source pathology software QuPath1 (GENFIT, Loos, France), could accurately identify cell histology patterns consistent with lobular inflammation and hepatocellular ballooning - markers of disease activity that are essential to establish the diagnosis and severity of NASH. The deep-learning system was able to predict cell histological patterns relating to ballooning and inflammation with accuracies of 98% and 91%, respectively. Excellent agreement was observed between the expert and fully automated scores of ballooning at a cellular level for each of the cohorts. An excellent correlation was also observed with the full tissue samples, and between whole slide imaging-based automatic scoring of inflammation on the training cohort.
John Brozek, Chief Data and Information Officer at GENFIT, said, “Deep-learning-based scoring systems allow an exhaustive and reproducible analysis of all cells in a biopsy sample, and they can analyze specific regions of cells that can be difficult to interpret manually, even if you are an expert'. Automated scoring system for ballooning and inflammation showed a high correlation with expert evaluation and it is ready to be used for high-throughput activity scoring in pre-clinical studies or, in the near future, as a companion diagnostic tool for clinical application.” The study was presented at The International Liver Congress held April 11-15, 2018, in Paris, France.
Related Links:
GENFIT
New
Gold Member
Pre- Eclampsia Control
Acusera Pre-Eclampsia Control

Urine Analyzer
respons® UDS100
Hematology Consumables
Bioblood Devices