Automated Slide-Based Approach Introduced for CBCs
By LabMedica International staff writers
Posted on 14 Sep 2017
The most commonly performed clinical laboratory test is the complete blood count (CBC). Currently, laboratory CBC systems obtain cell counts and morphologic information by maintaining the blood cells in a liquid “flow” and by using the Coulter impedance-based orifice or laser-based cytometry.Posted on 14 Sep 2017
A novel automated slide-based approach to the complete blood count and white blood cell differential count has been introduced. A proof of concept for an image-based approach to complete blood count, based on a new slide preparation technique has been compared with the current flow-based technology.
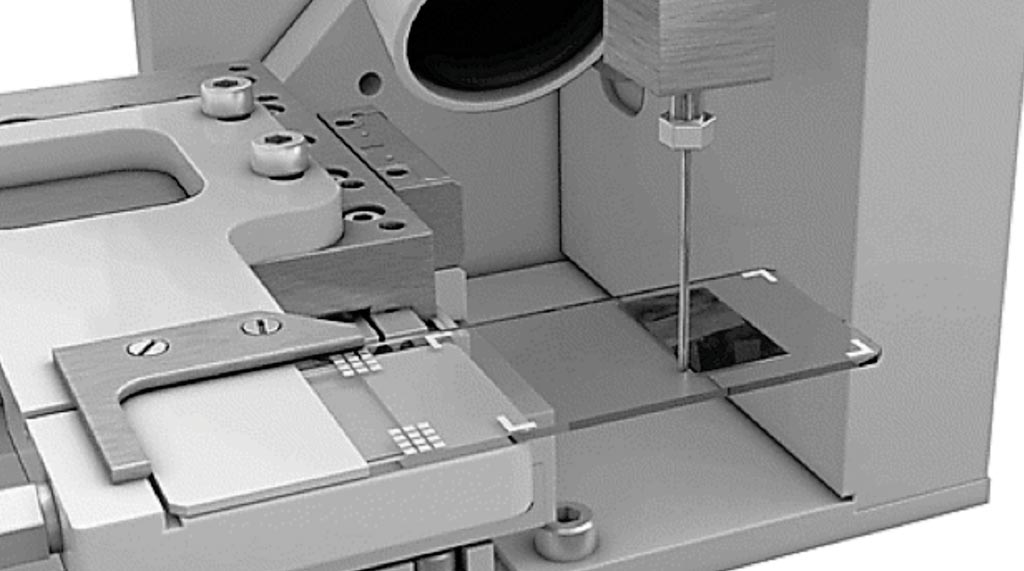
Image: The novel automated slide-based approach: a microscope slide is moved under a blunt needle, providing a constant flow of whole blood. Typically, 1 μL of blood is deposited (Photo courtesy of James W. Winkelman, MD, et al).
Clinical Laboratory Scientists at Brigham and Women's Hospital (Boston, MA, USA) and their colleagues analyzed specimens were from a wide array of deidentified adult and pediatric inpatients and outpatients with a range of medical conditions, including hematologic and other malignancies. Specimens were sought and collected for comparison that had very high or low results for various parameters, without regard to diagnosis.
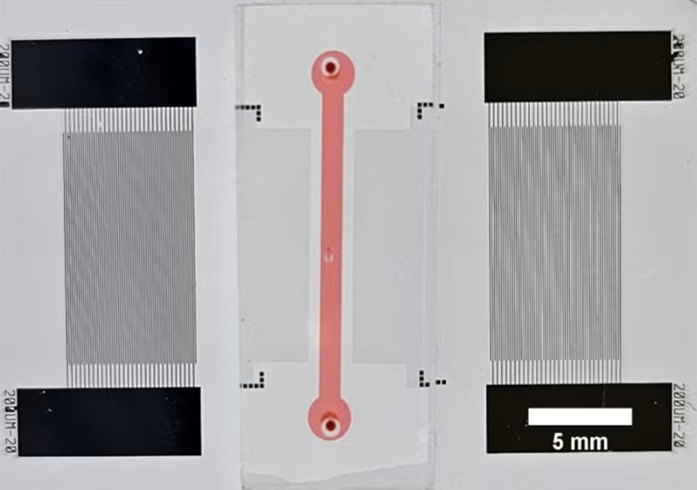
The investigators operated a prototype instrument that uses a proprietary method and technology to deposit a precise volume of undiluted peripheral whole blood in a monolayer onto a glass microscope slide so that every cell can be distinguished, counted, and imaged. The slide is stained, and then multispectral image analysis is used to measure the complete blood count parameters. Images from a 600-cell white blood cell differential count, as well as 5,000 red blood cells and a variable number of platelets that are present in 600 high-power fields are made available for a technologist to view on a computer screen. An initial comparison of the basic complete blood count parameters was performed, comparing 1,857 specimens on both the new instrument and a flow-based XE-5000 hematology analyzer.
The team found excellent correlations were obtained between the prototype instrument and a flow-based system. All parameters showed good to excellent correlation over a range of values spanning 1.79 × 10⁶/μL to 6.8 × 10⁶/μL for red cells; 0.01 × 10³/μL to 60.4 × 10³/μL for leucocutes; and 5 × 10³/μL to 922 × 103/μL for platelets. The primary parameters of white blood cell, red blood cell, and platelet counts resulted in correlation coefficients (r) of 0.99, 0.99, and 0.98, respectively. Other indices included hemoglobin (r = 0.99), hematocrit (r = 0.99), mean cellular volume (r = 0.90), mean corpuscular hemoglobin (r = 0.97), and mean platelet volume (r = 0.87). For the automated white blood cell differential counts, r values were calculated for neutrophils (r = 0.98), lymphocytes (r = 0.97), monocytes (r = 0.76), eosinophils (r = 0.96), and basophils (r = 0.63).
The authors concluded that quantitative results for components of the complete blood count and automated white blood cell differential count can be developed by image analysis of a monolayer preparation of a known volume of peripheral blood. The study was published in the August 2017 issue of the journal Archives of Pathology & Laboratory Medicine.
Related Links:
Brigham and Women's Hospital


